Site menu:
Estimating overlap of activity patterns
In Ref [2] Matt Linkie and I looked at overlap of activity patterns of the Sumatran tiger (below) with several of its prey species, using statistical methodology outlined in [Ref 1] The data consist of times of day of photographs of different species, from camera trap records. These data are used to estimate the activity pattern of each species over the day (as a probability density function) and then, for a given pair of species, the degree of overlap between the two estimated densities can be estimated, using methods from [Ref 5].
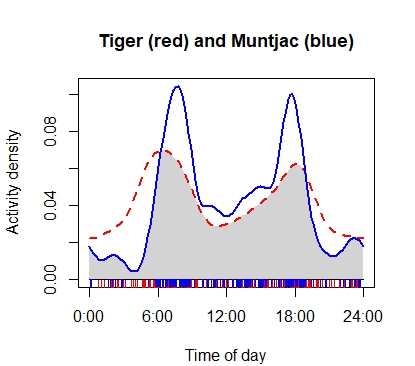
The figure on the right shows the overlap between tiger and muntjac, which was the species that showed the greatest degree of overlap - estimated as 0.80, with a 95% confidence interval (0.71, 0.84) [Ref 2]. The red and blue lines are the estimated activity patterns of each species and the overlap is calculated as the area of the grey shaded region.
Statistical method
In statistical terminology, time of day records are an example of circular data. Activity patterns are obtained either by kernel density estimation or by fitting a flexible parametric family of circular distributions called trigonometric sum distributions [Ref 3]. These two approaches usually give very similar results and only the more flexible kernel density estimation is implemented in the software described below.
The measure of overlap used is the coefficient of overlapping [Ref 4], which is the area under the curve that is formed by taking the minimum of the two density functions at each time point. This is denoted by Δ in the papers and can range from 0 (no overlap, e.g. one species entirely diurnal, the other entirely nocturnal) to 1 (complete overlap, identical activity patterns). A useful interpretation is that for any time period during the day, the proportion of activity that occurs during that period differs between the two species by less than 1-Δ.
R software is available.
References
[1] Ridout, M.S. & Linkie, M. (2009) Estimating overlap of daily activity patterns from camera trap data. Journal of Agricultural, Biological and Environmental Statistics, 14, 322-337. doi: 10.1198/jabes.2009.08038 [pdf]
[2] Linkie, M. & Ridout, M.S. (2011) Assessing tiger-prey interactions in Sumatran rainforests. Journal of Zoology, 284, 224-229. doi 10.1111/j.1469-7998.2011.00801.x [pdf]
[3] Fernandez-Duran, J.J. (2004) Circular distributions based on non-negative trigonometric sums. Biometrics, 60, 499-503. doi: 10.1111/j.0006-341X.2004.00195.x
[4] Weitzman, M.S. (1970) Measures of overlap of income distributions of white and negro families in the United States. Technical Report 22, US Department of Commerce, Bureau of the Census, Washington DC. [Can be viewed here]
[5] Schmid & Schmidt (2006) Nonparametric estimation of the coefficient of overlapping - theory and empirical application. Computational Statistics and Data Analysis, 50, 1583-1596. doi: 10.1016/j.csda.2005.01.014